

Generate Easy-To-Understand Power Quality Reports with ITIC Plotting
Brief History of ITIC Curves
In 1977 a group called the Computer & Business Equipment Manufacturer’s Association (CBEMA) formed with the mission of developing a curve to show the ability of computer equipment to withstand voltage events. This group published a curve as part of IEEE Std 446. In 1996, this group became the Information Technology Industry Council (ITIC), and published the curve still being used today. This curve is meant to represent typical loads and how sensitive the loads are to voltage events. Some loads have been found to be have longer ride-through times and some loads have been found to be less tolerant.
How to Read the Curve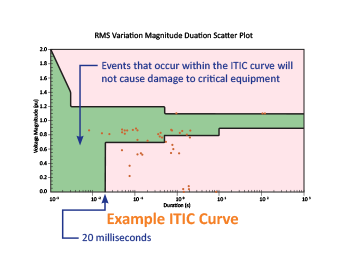
The y-axis displays the percentage of nominal voltage, and the x-axis represents time typically shown using a logarithmic scale. If the voltage is contained within the boundaries the load will be maintained. The example to the right shows events plotted both in and out of the boundaries. Equipment and system designers key in on the zero voltage limit which is 20 milliseconds.
LayerZero Products & The ITIC Curve
All LayerZero Power Systems products have built-in power quality analyzers that break down power sources into samples. LayerZero Static Transfer Switches are equipped with user-defined setpoints, and if the power quality goes out of specification - eSTS will quickly transfer to the alternate source, automatically generating waveform captures and ITIC curves of the event. This data is remotely accessible by connecting to the unit via web browser.
Waveform captures provide a phase-by-phase graph of the voltage/amps over a period of time, and typically requires a well-trained expert to read and interpret the results. ITIC plots do not require an expert analysis, they are simple, easy-to-understand graphs on whether connected critical equipment was impacted by power quality events or not.
Proving STS Performance
A common critical power distribution system consists of STS systems switching at 480 volts, connected to downstream PDUs with transformers. In critical electrical distribution systems, the phase relationship of two sources sometimes drift apart. When sources are out-of-phase, a ¼ cycle transfer will cause the transformer to draw large inrush currents. These inrush currents could potentially trip upstream overcurrent devices and take down large blocks of critical load. To help mitigate transformer inrush, LayerZero deploys a transfer algorithm called “Dynamic Phase Compensation”. This algorithm senses if sources are out-of-phase, and delays the transfer until the perfect moment to switch sources, reducing inrush to practically nothing at all. Utilizing Dynamic Phase Compensation, the transfer time is lengthened to around a ½ cycle (8.33 milliseconds) - easily within the bounds of the ITIC curve.
Monitoring & Reporting
All LayerZero products contain an embedded metering system that continuously monitors the voltage. Any power quality event, such as a source transfer, overcurrent, undercurrent, or overvoltage - will automatically trigger a waveform capture and ITIC plot generation. This provides end-users with the ability to audit the effects of power quality events on all connected LayerZero equipment. For example, if an static transfer switch transfers sources, users will be able to see a timestamped waveform capture and ITIC plot of the event at the STS, PDU, and RPP levels. The ITIC plot will instantly provide an answer to whether any connected equipment was potentially damaged by the event - without the need for expert analysis.
Example ITIC Plots from LayerZero Products
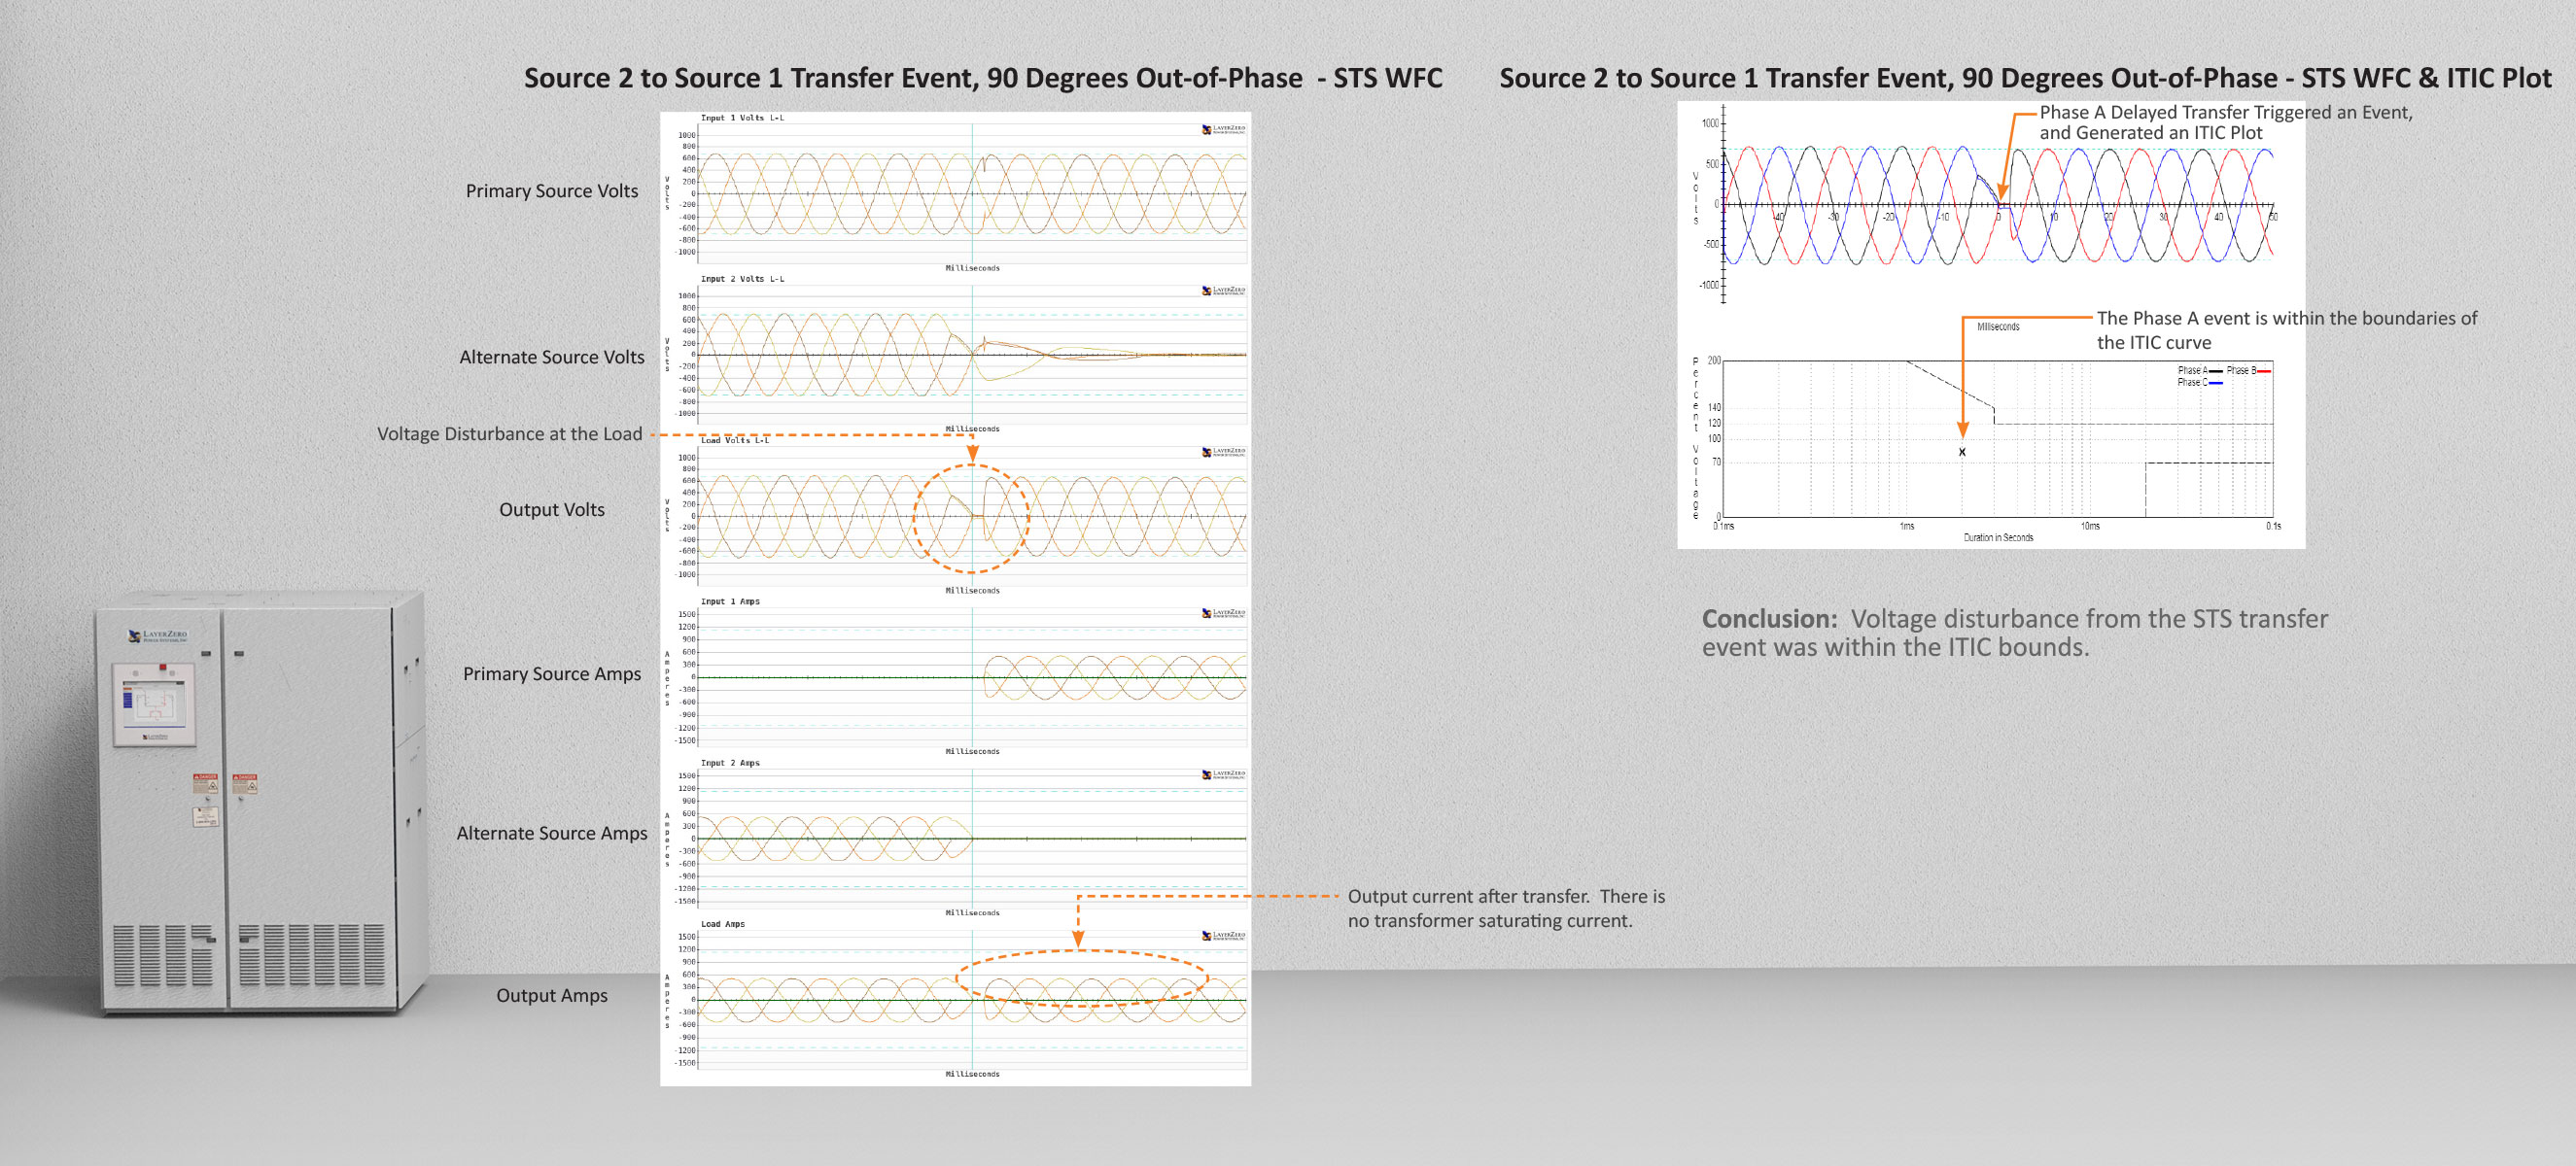
Source 2 to Source 1 Transfer Event, 90 Degrees Out-of-Phase - Static Transfer Switch Waveform Capture and ITIC Plot
The following “primary to secondary transfer” factory test was performed on a LayerZero 480 V, 800 A, 2 source Static Transfer Switch (STS) connected to two sources 90 degrees out-of-phase. Source 2 breaker was opened, causing the STS to perform an automatic transfer to the primary source. A delayed transfer occurred, causing an event on Phase A, generating an ITIC plot.
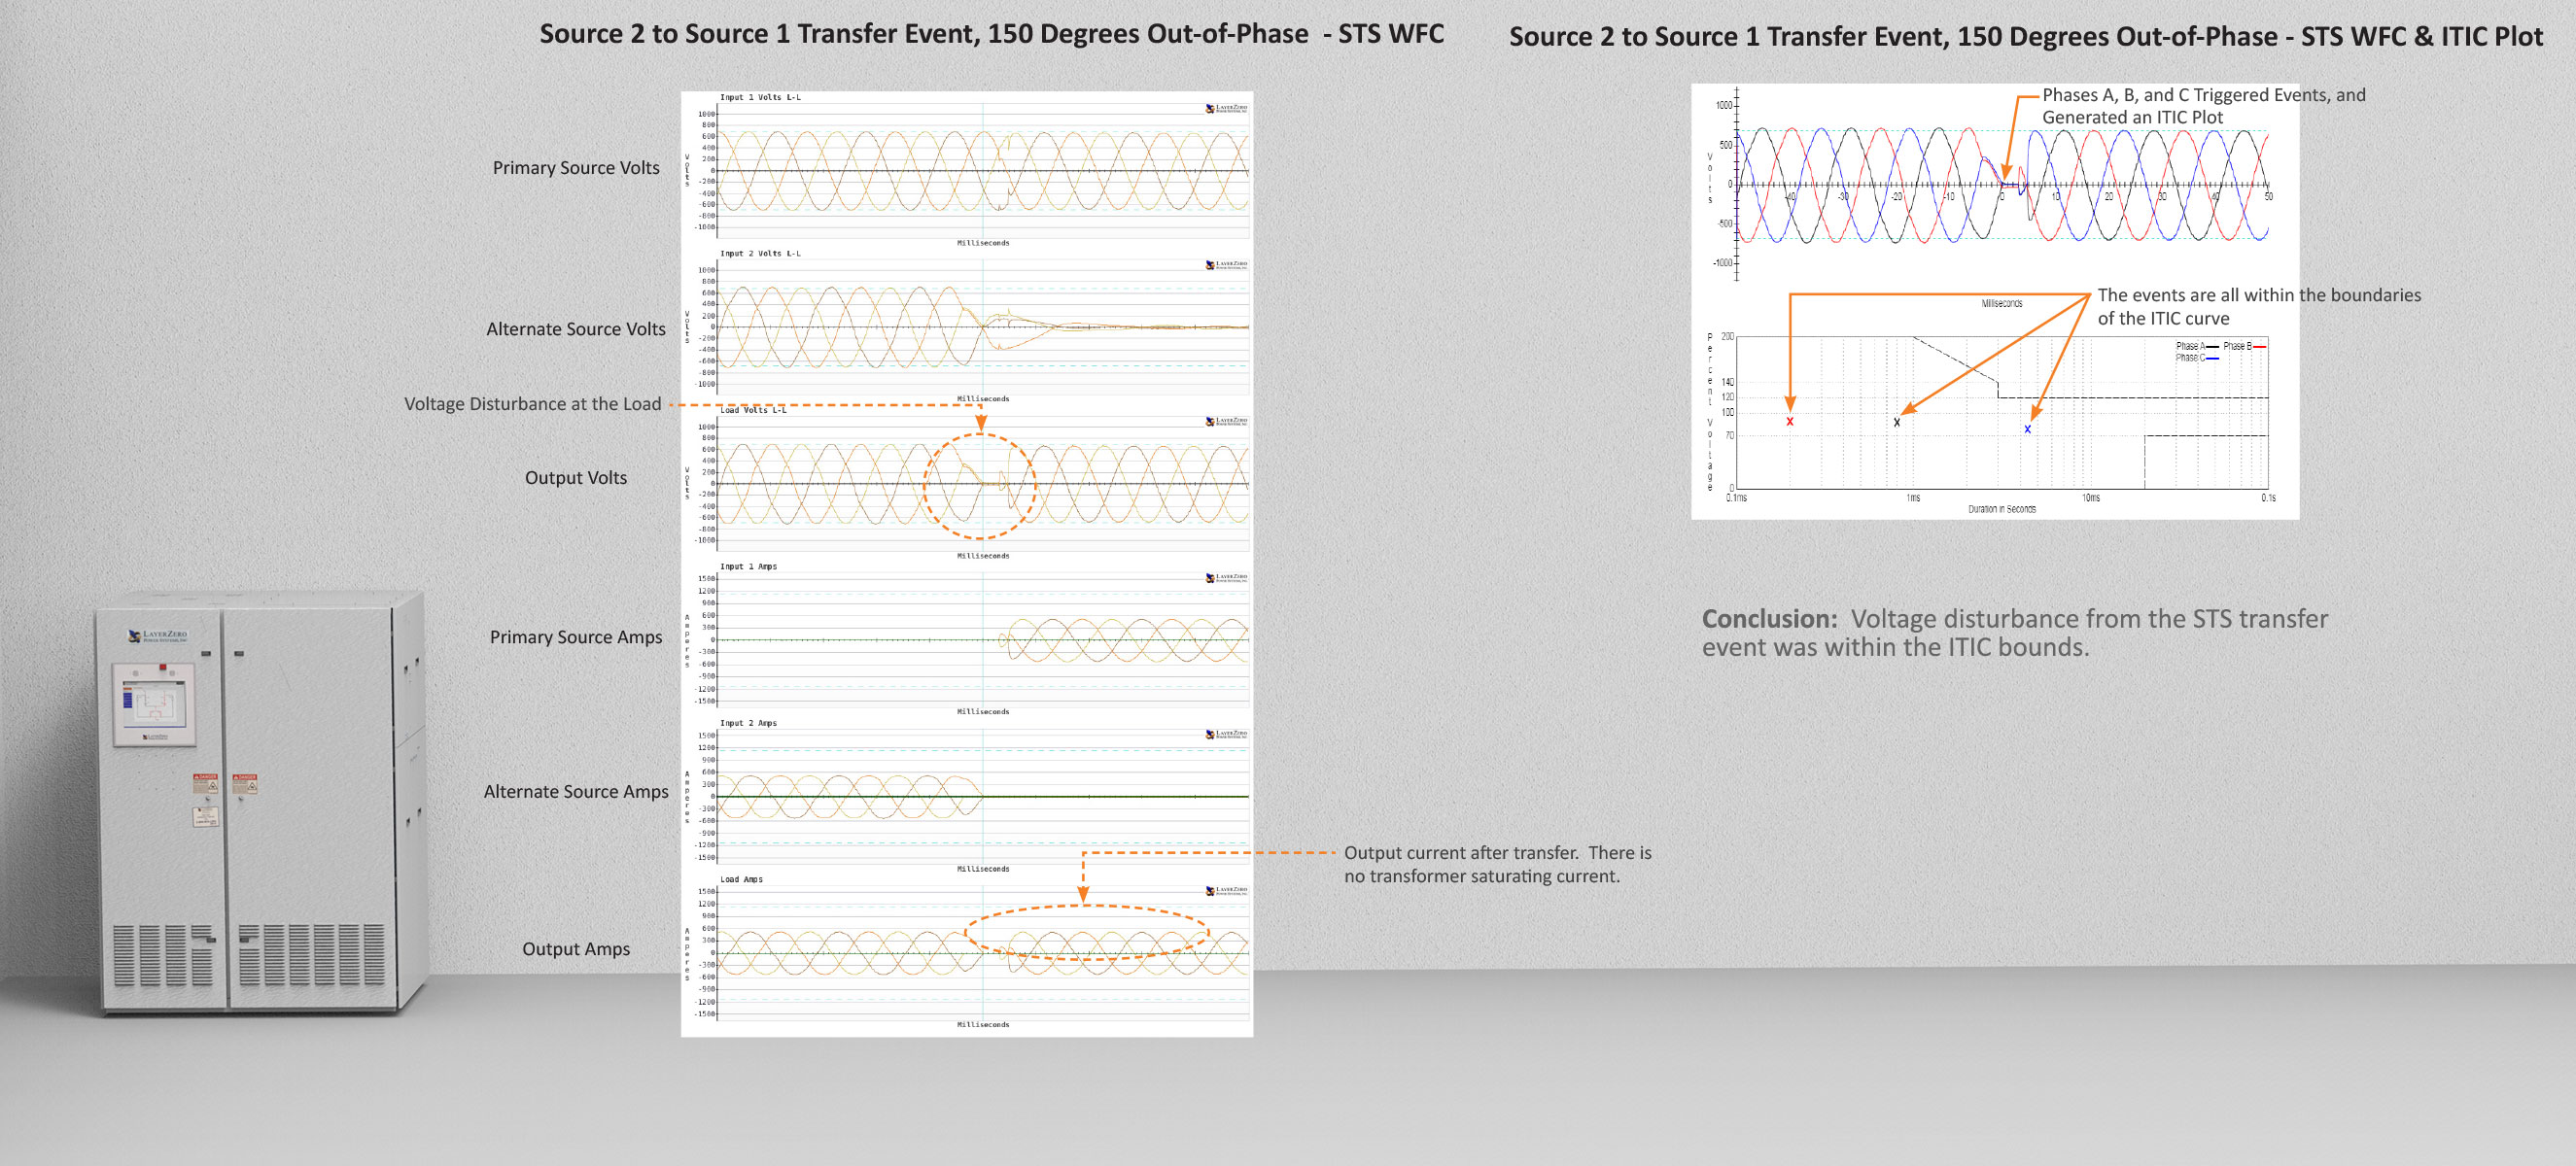
Source 2 to Source 1 Transfer Event, 150 Degrees Out-of-Phase - Static Transfer Switch Waveform Capture and ITIC Plot
The test below exemplifies LayerZero’s “Dynamic Phase Compensation” algorithm in action. In this test, a 480 VAC STS with downstream transformer was connected to two sources 150 degrees out-of-phase. Source 2 breaker was opened, causing the STS to perform an automatic transfer to the primary source. To eliminate transformer inrush, Dynamic Phase Compensation delayed the transfer for approximately three milliseconds, causing events on Phases A, B, and C, automatically generating ITIC plots.
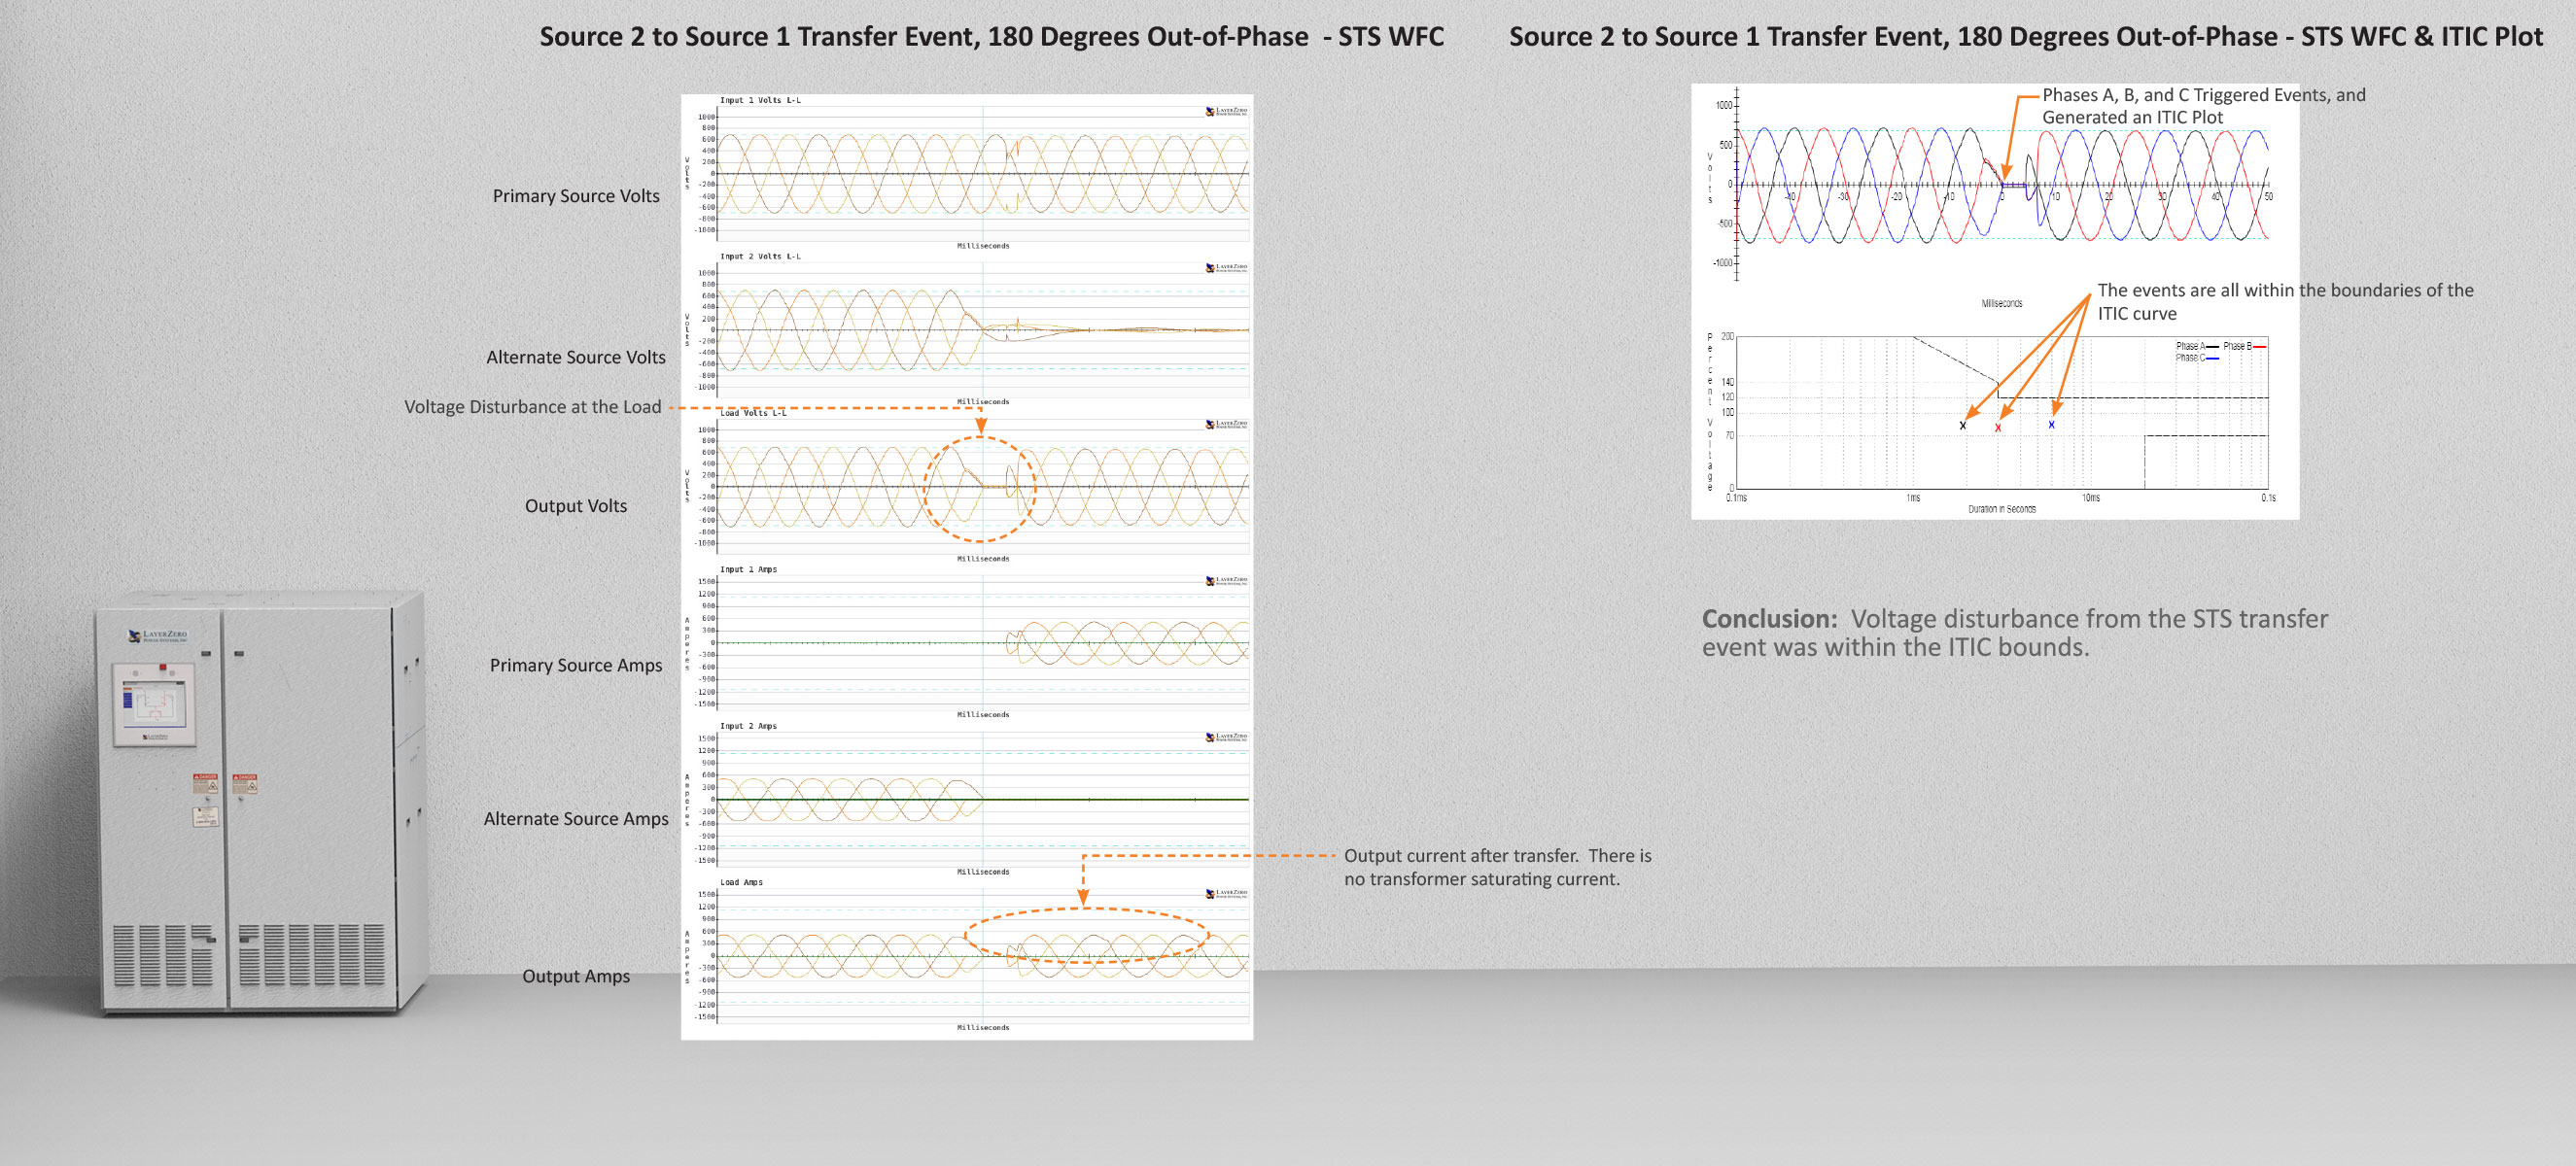
Source 2 to Source 1 Transfer Event, 180 Degrees Out-of-Phase - Static Transfer Switch Waveform Capture and ITIC Plot
In the test below, the STS was connected to two sources 180 degrees out-of-phase. While the STS was operating on Source 2, the Source 2 feeder breaker was opened, causing the STS to perform an automatic transfer to the primary source. A delayed transfer occurred, causing events on Phases A, B, and C, automatically generating ITIC plots.
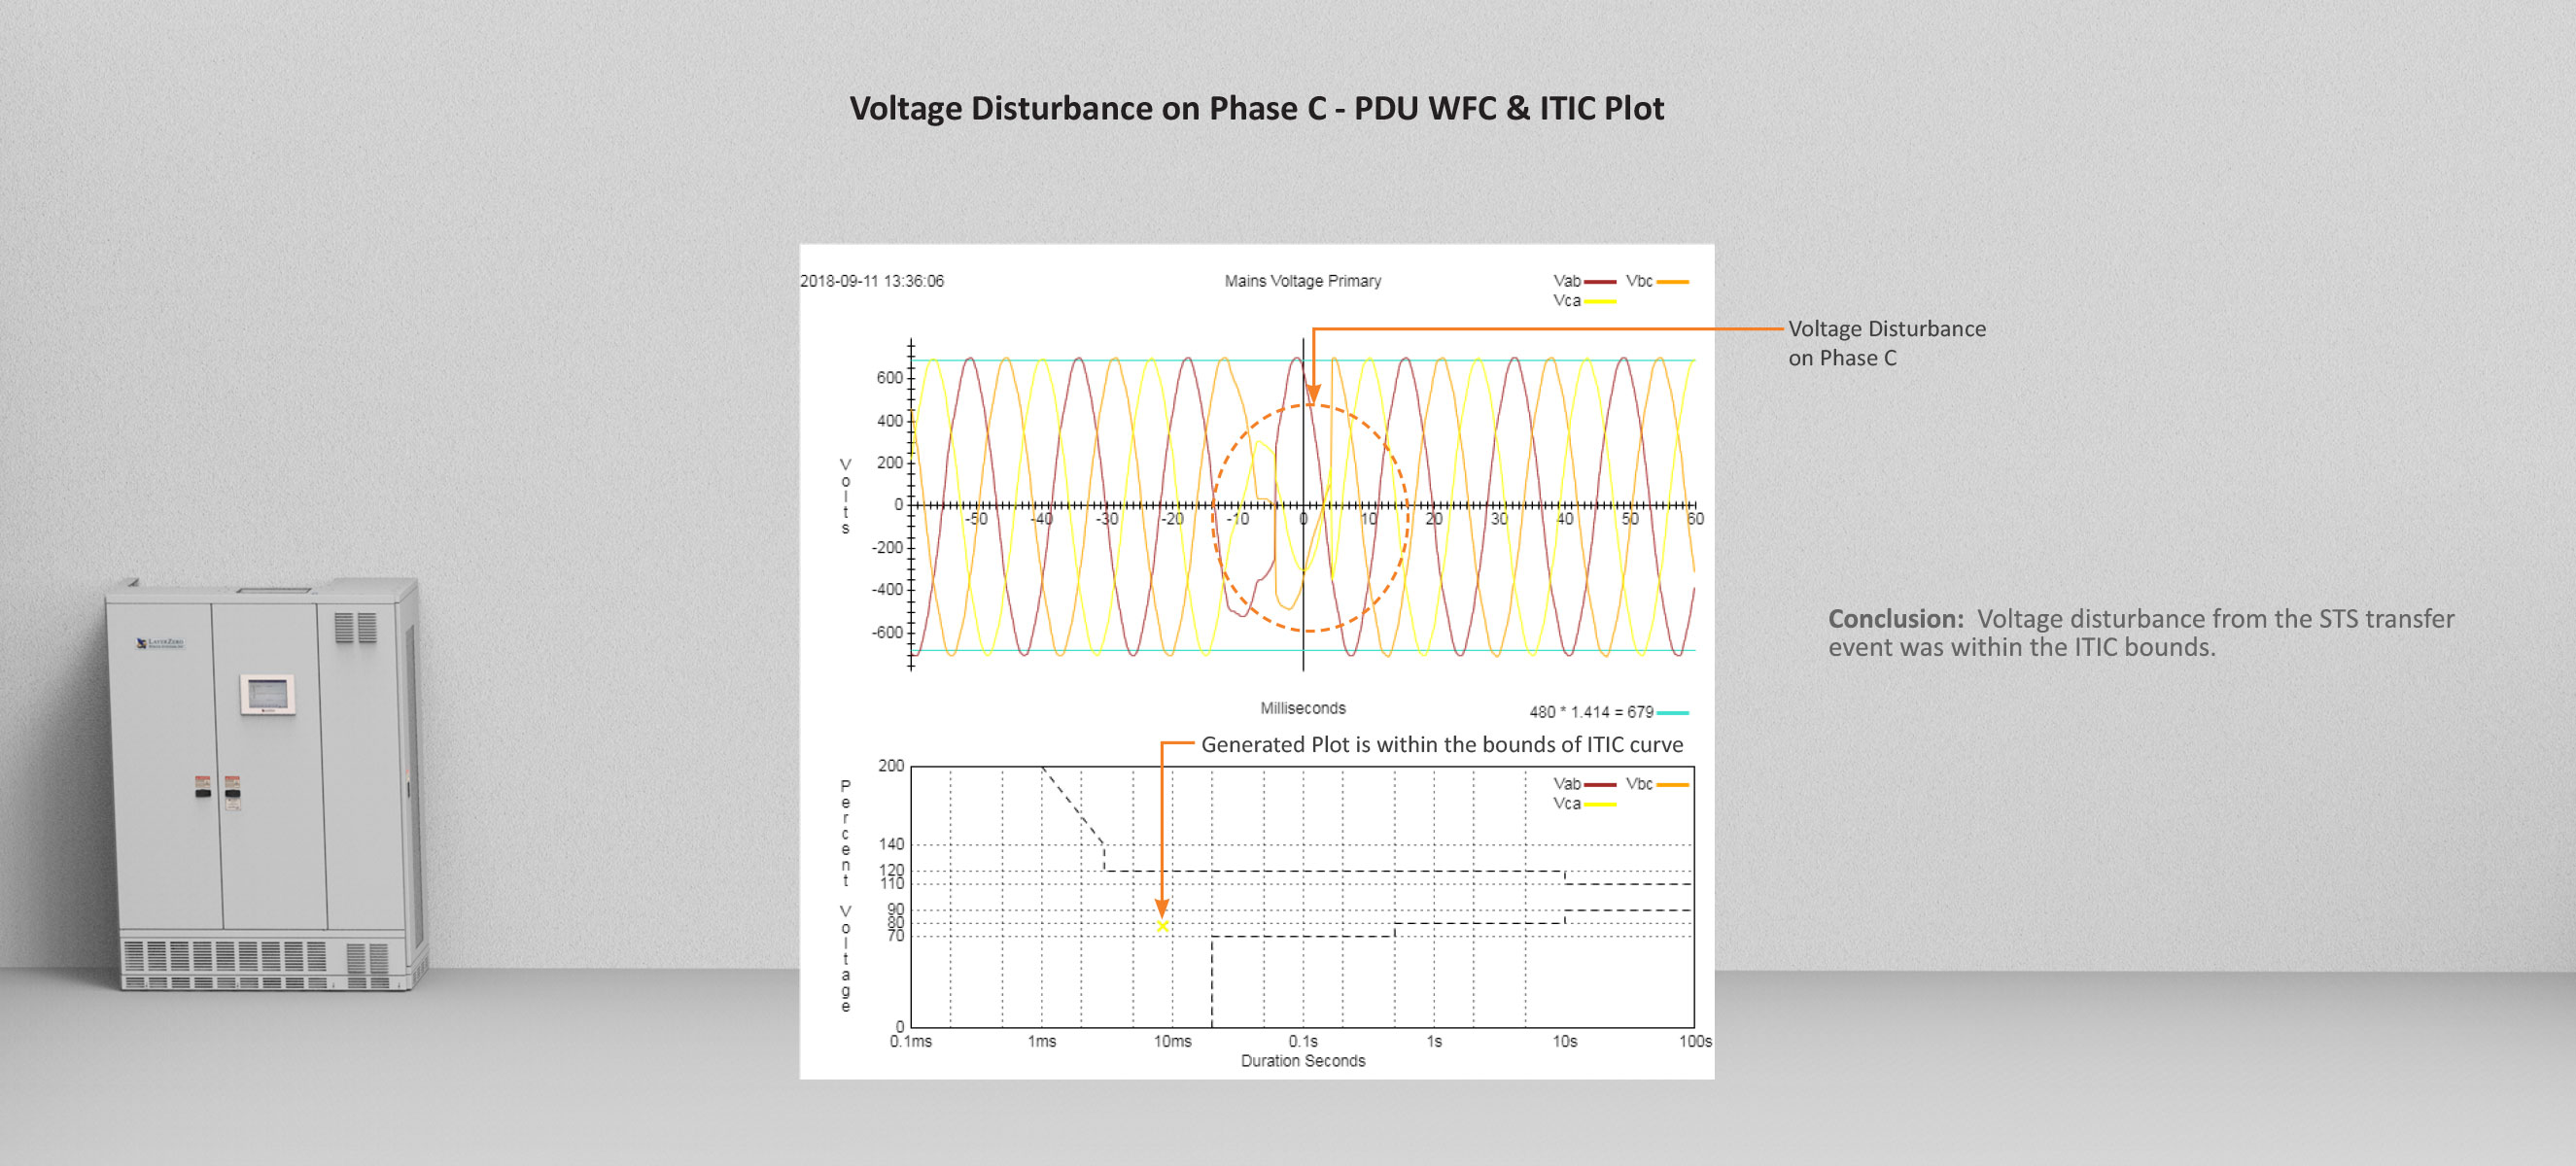
PDU Voltage Disturbance - Power Distribution Unit Waveform Capture and ITIC Plot
In the test below, the PDU experienced a voltage disturbance on Phase C. This voltage disturbance caused an event on Phase C, generating a waveform capture and ITIC plot.
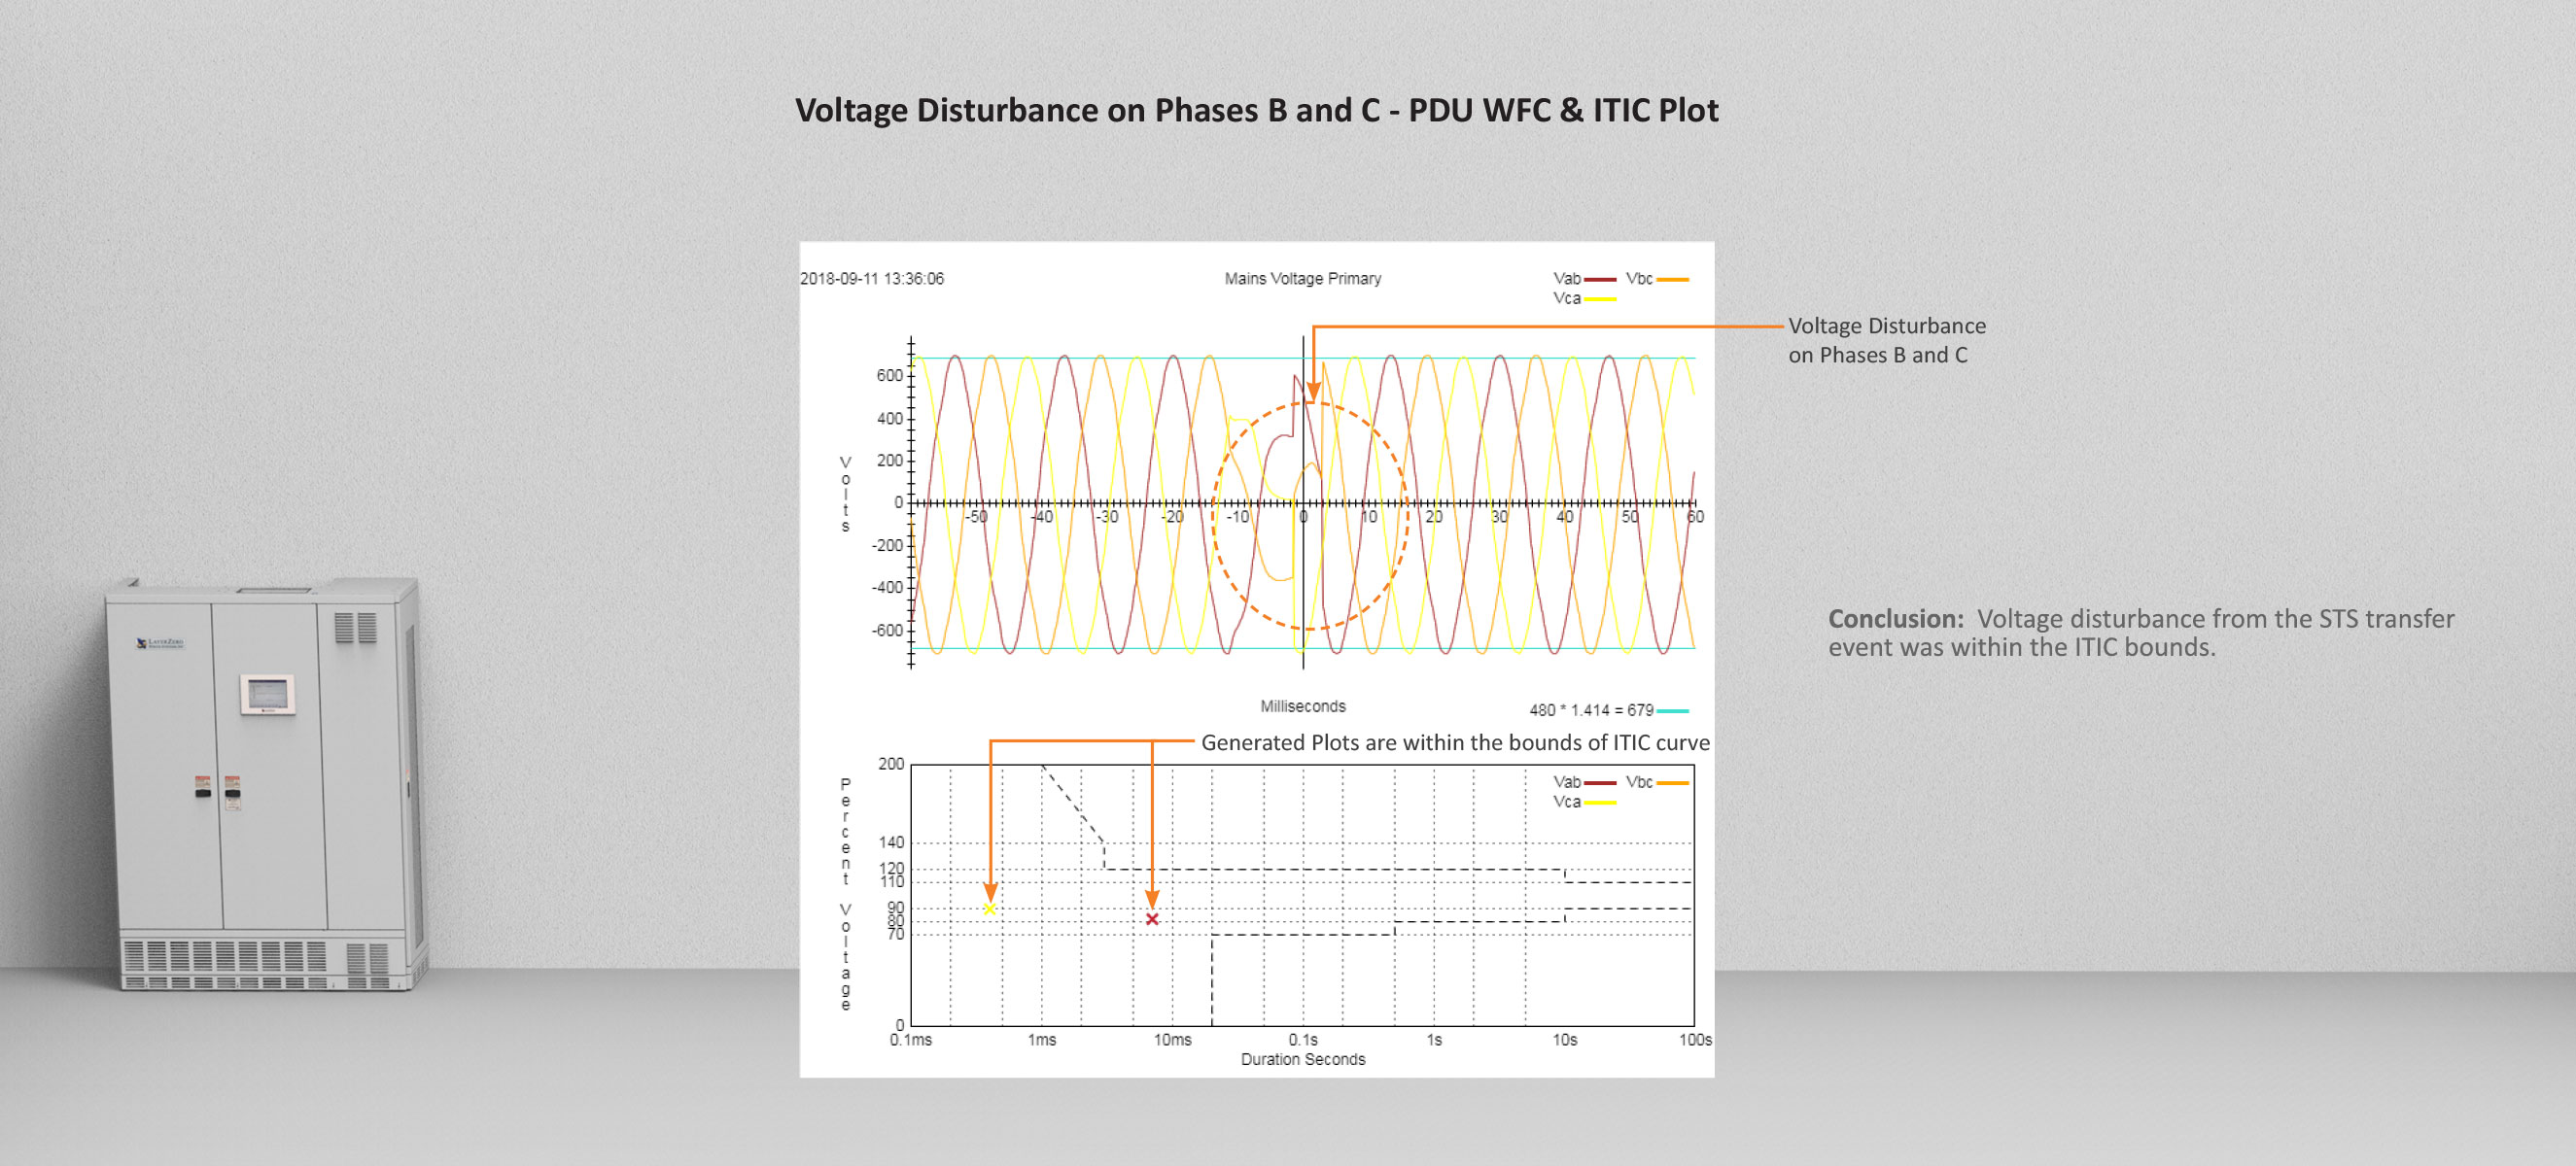
PDU Voltage Disturbance - Power Distribution Unit Waveform Capture and ITIC Plot
In the test below, the PDU experienced a voltage disturbance on Phases B and C. This voltage disturbance caused events on Phases B and C, generating a waveform capture and ITIC plots.
Contact LayerZero today to learn more about how ITIC plotting can help better understand the effects of power quality events in your critical facility.